Evolved Massive Stars at Low-metallicity II. Red Supergiant Stars in the Small Magellanic Cloud
Ming Yang, Alceste Z. Bonanos, Bi-Wei Jiang, Jian Gao, Panagiotis Gavras, Grigoris Maravelias, Shu Wang, Xiao-Dian Chen, Frank Tramper, Yi Ren, Zoi T. Spetsieri, Meng-Yao Xue
Abstract
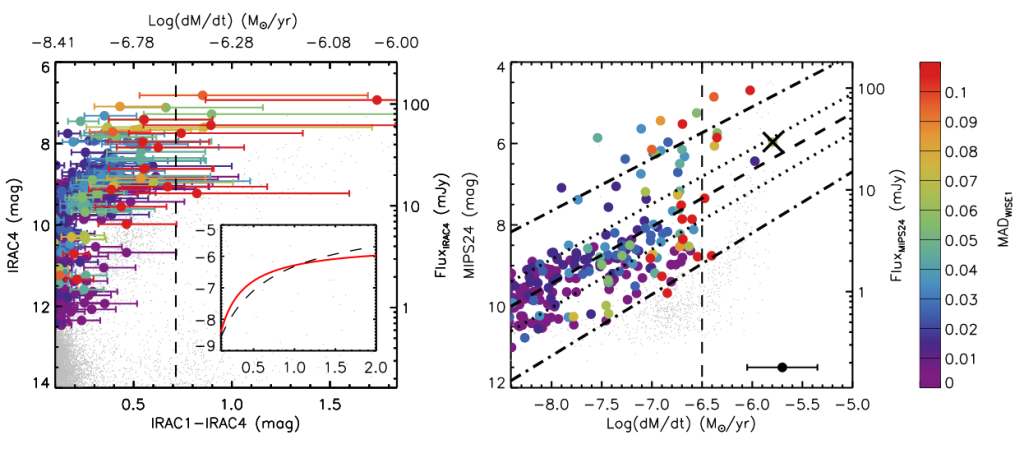
We present the most comprehensive RSG sample for the SMC up to now, including 1,239 RSG candidates. The initial sample is derived based on a source catalog for the SMC with conservative ranking. Additional spectroscopic RSGs are retrieved from the literature, as well as RSG candidates selected from the inspection of CMDs. We estimate that there are in total ∼ 1,800 or more RSGs in the SMC. We purify the sample by studying the infrared CMDs and the variability of the objects, though there is still an ambiguity between AGBs and RSGs. There are much less RSGs candidates (∼4%) showing PAH emission features compared to the Milky Way and LMC (∼15%). The MIR variability of RSG sample increases with luminosity. We separate the RSG sample into two subsamples (“risky” and “safe”) and identify one M5e AGB star in the “risky” subsample. Most of the targets with large variability are also the bright ones with large MLR. Some targets show excessive dust emission, which may be related to previous episodic mass loss events. We also roughly estimate the total gas and dust budget produced by entire RSG population as ∼1.9(+2.4/−1.1)×10<sup>−6</sup> M⊙/yr in the most conservative case. Based on the MIST models, we derive a linear relation between Teff and observed J−KS color with reddening correction for the RSG sample. By using a constant bolometric correction and this relation, the Geneva evolutionary model is compared with our RSG sample, showing a good agreement and a lower initial mass limit of ∼7 M⊙ for the RSG population. Finally, we compare the RSG sample in the SMC and the LMC. Despite the incompleteness of LMC sample in the faint end, the result indicates that the LMC sample always shows redder color (except for the IRAC1−IRAC2 and WISE1−WISE2 colors due to CO absorption) and larger variability than the SMC sample.

NASA/ADS: 2020A&A…639A.116Y
